Note: I have since shutdown my SSH server, and thus will no longer update the map
Recently, I have completed what I am calling the attack map. Basically, I’ve been intrigued by these live attack maps that you find on different sites.
Some of them are admitingly cool like this one: A Cool Map However, other maps are laggy, confusing messes: A Bad Map
After looking through many of the log files on the ssh server I host on my personal desktop, I realized that a very similar looking map could be created using the data gathered from this server. The data utilized for this project can be found in the auth.log files linux keeps.
Whenever a successful or failed login attempt is made, it will be logged in this file. All I have to do is scan line by line for log entries such as:
May 20 11:51:06 MyComputer sshd[20393]: User root from 121.18.238.115 not allowed because not listed in AllowUsers |
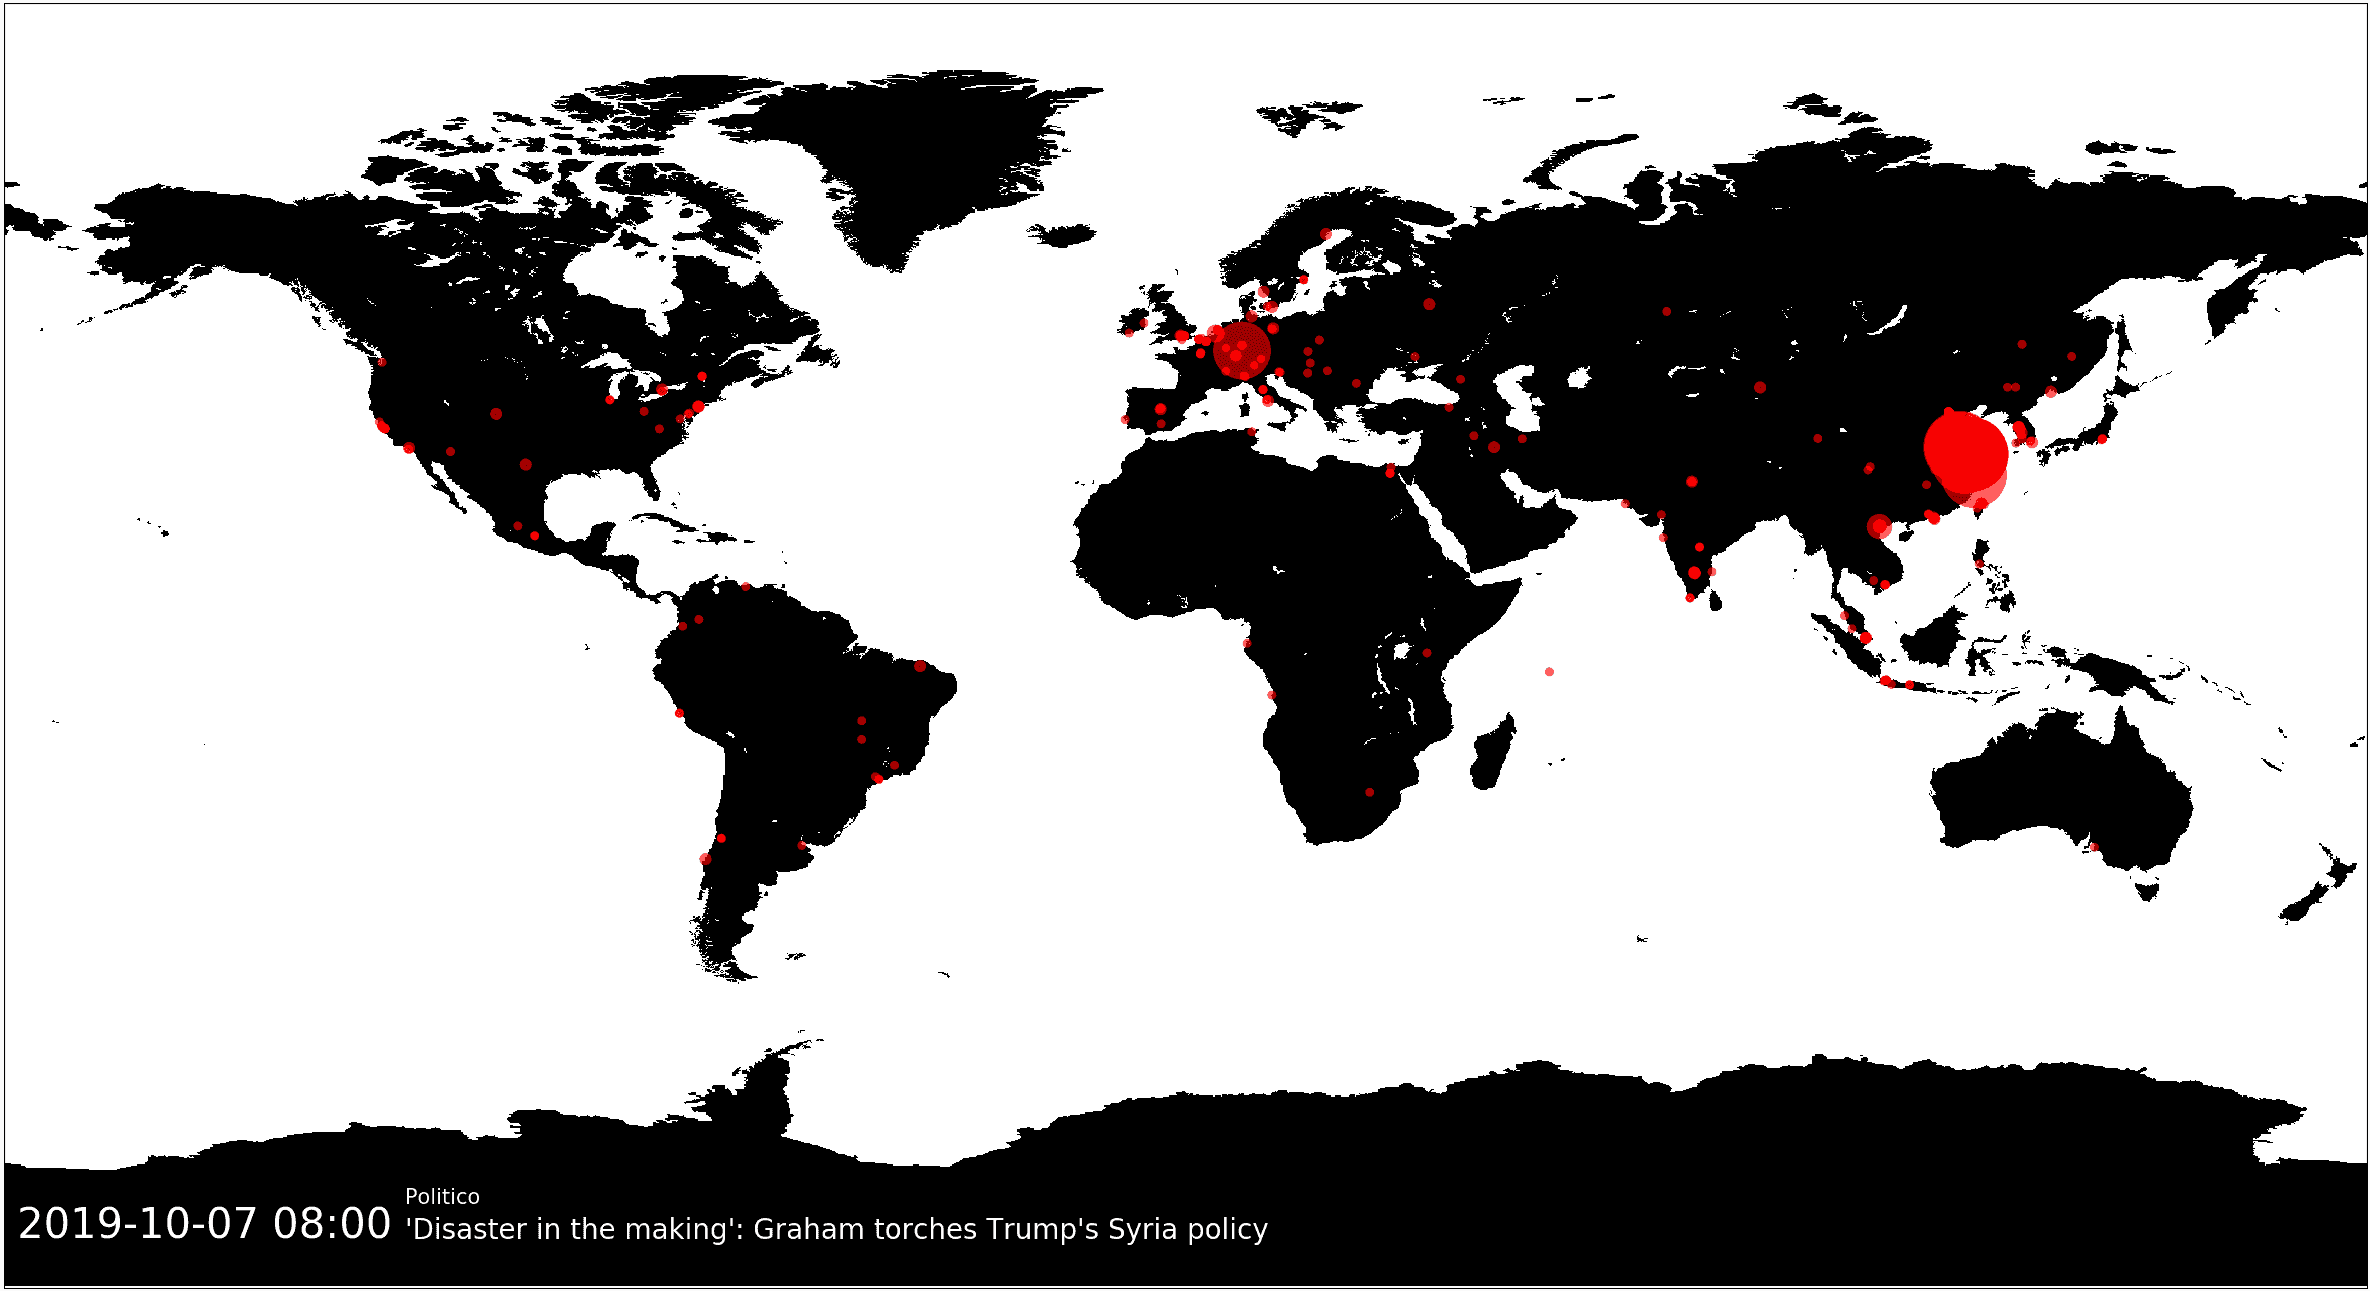
And store the relevant ip address contained in this particular type of log entry. I then use the ip-api to lookup the geolocation for each new ip address, caching them between runs of the script for effeciency. Finally, I plot each of these ip addresses, along with the number of attempts sourced from each using the basemap python library.
More information on this map can be found here