Often, I find myself having to explain what a p-value is. In data science and machine learning, p-values are often used to assess the significance of results. However, many people - even within technical fields — struggle to understand what a p-value really means. In this post, I’ll break down the concept of p-values and demonstrate its practical application using a toy example.
Definition of a P-Value
A p-value is the probability that the observed results, especially more extreme results, would occur under the assumption that the null hypothesis is true. Put simply, it’s a measure of how likely it is that the results were due to chance. For most people, I don’t believe this definition is very intuitive at first glance. Let’s break this down into the 3 main points so that we can go over them individually. Then, we will combine them together again so we can appreciate the whole definition.
Null-Hypothesis
The null-hypothesis, often notated as , is the assumption that we make before we begin measuring anything. For example, if we are testing a vaccine, we might say that the is that receiving the vaccine makes no difference in preventing infection. Typically, our will be to assume whatever our data shows is due to random chance. Even if it’s fairly obvious, it’s critical to define one before so we can avoid misinterpreting the data.
For example, what is the probability that a dart thrown from an airplane will hit a target? The probability our dart hits any given point on the ground is very low. However, the probability that the dart will hit anywhere on the ground is very high - say 100%. If we draw our target on the ground before we throw the dart, it would be very impressive if we got a bullseye. However, if we instead throw the dart, and then draw a target around where it lands, no one should be impressed. This demonstrates how defining our before we begin is critical to meaningful conclusions. Otherwise, we risk misinterpreting random events as significant.
Observations
The p-value is only as useful as what we are measuring. Going back to the vaccine example, one thing we could measure is taking two groups of people, one with the vaccine and the other with a placebo, and then measure who gets infected over the next 6 months.
| Infected | Non-infected | |
|---|---|---|
| Vaccine | 100 | 900 |
| Placebo | 200 | 800 |
Looking at the ratios, it looks like around of vaccinated people got infected. Of those that received the placebo, of those got infected by the end of the trial period. Does the vaccine work? While the observed difference is quite large, can we say for certain the vaccine works? Perhaps, if we reran the experiment, we’d get the exact opposite results? Even if the two groups had identical demographics and behavior, the difference between the two could still be explained by random chance.
We can think of our two groups as samples from a larger population – i.e. the entire human race. If we took a random group of 1000 people from all over the world, what proportion of them do we expect to become infected after 6 months? On average, it should be the same as the number of people who become infected globally divided by the population of humanity. However, it’s not guaranteed that it will equal the global infection rate. If we say the global rate is , and we change our sample size to , then we’d either have an observed infection rate of or . As we increase our sample size, the average error we observe from the global population gets smaller and smaller.
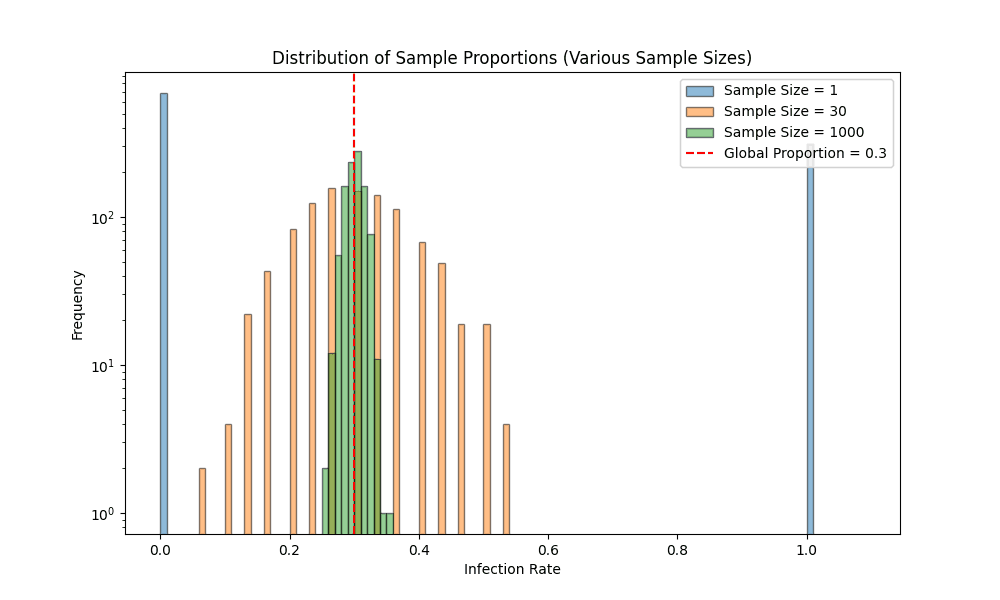
In the graph above, you can see how larger sample sizes reduce the variability of results. This is crucial when comparing two groups—if the difference between them is larger than what we’d expect by chance, we can conclude that the groups are significantly different. If our vaccine improves the infection rate, then the populations should be statistically significant. On the other hand, if our vaccine has no effect, then the population of vaccinated people should not differ from the vaccinated. This is why we need to calculate the probability that the two samples came from the same distribution.
Calculating Probability
For our vaccine trial example, we can use a simple z-test to determine the probability that two groups differ only by random chance.
First, we need to calculate the proportions of each group that became infected:
Then, we can determine the pooled proportion . That is we combine both groups and find the total proportion infected:
Then, we can determine the standard error (SE), which measures how much variability we expect between the two groups if they came from the same population:
We can then plug in the values and get a solution:
The reason we needed to get the standard error is that we can use it to determine the z-statistic () between our two proportions. That is:
The z-statistic is essentially a measure of how many standard deviations from the average result our observation is. For example, if we ran hundreds of thousands of trails of just the placebo, we’d expect around of results to fall within 1 standard deviation (i.e. is between and ). The p-value tells us the probability that the results we observed were due to random chance. If this probability is low, it suggests the results are significant. In our case, with the z-score of -6.26, the chance of the vaccine having no effect is virtually zero.
Putting it all together
What we’ve done today is quite astounding. We can use the properties of sampling – mainly that they will differ predictably from a global population – and determine the probability that two samples came from the same population. If the difference is too large, given the sample sizes, then the chance they come from the same population will be low. For our example, the chance is so low that we can reject our null-hypothesis – that being that vaccines have no effect. Thus, we can say that the vaccine does reduce the rate of infection.
Ultimately, p-values help us make data-driven decisions with greater confidence. But remember, interpreting them correctly requires understanding the trade-offs between confidence and cost, especially when working with large datasets or expensive experiments. By mastering p-values, you can avoid misleading conclusions and make better decisions based on data.
While you can lower p-values by increasing your sample size, that also can increase costs and turn-around-time. Performing a drug trial on hundreds of thousands of people can be very expensive. Correctly judging the trade off between confidence and cost is a tricky call.